Hugging Faceを見てたら、なんかグラフを説明するっぽいモデルがあったので試してみました。
あと、JavaのUIからPythonを呼び出す練習でもある。
とりあえず、こんな感じでグラフの説明をしてくれます。ここではArrayやStreamに対応する数値を読み取ってもらったり、一番速い時間を返してもらったりしてます。
グラフ説明するくんができた pic.twitter.com/zV4yfg85Ld
— きしだൠ(K1S) (@kis) 2023年4月24日
まあ、うまくいったものだけを見せているので、だいたいちゃんと答えてくれませんが。
Hugging Faceを見てたら、なんかグラフの説明をしてくれそうなGoogle産モデルがあったので試してみました。
https://huggingface.co/google/matcha-chartqa
モデルの変換とかが必要そうなんだけど、ybelkadaさんのところに置いてあるのでそれを使います。
import sys
from transformers import Pix2StructForConditionalGeneration, Pix2StructProcessor
from PIL import Image

model_name = "ybelkada/matcha-chartqa"
model = Pix2StructForConditionalGeneration.from_pretrained(model_name)
model.to("cuda:0")
processor = Pix2StructProcessor.from_pretrained(model_name)

while True:
    path = input()
    q = input()

    image = Image.open(path)
    inputs = processor(images=image, text=q, return_tensors="pt").to(0)
    predictions = model.generate(**inputs, max_new_tokens=512)
    print(processor.decode(predictions[0], skip_special_tokens=True))
ProcessBuilder pb = new ProcessBuilder(PYTHON_PATH, SCRIPT_PATH);
pb.redirectErrorStream(false);
Process p = pb.start();

OutputStream os = p.getOutputStream();
pyIn = new PrintWriter(os);

InputStream is = p.getInputStream();
pyOut = new BufferedReader(new InputStreamReader(is));
ボタンを押したときに入力を渡して受け取ったものを表示させます。
pyIn.println(path.getAbsolutePath());
pyIn.println(question);
pyIn.flush();
return pyOut.readLine();
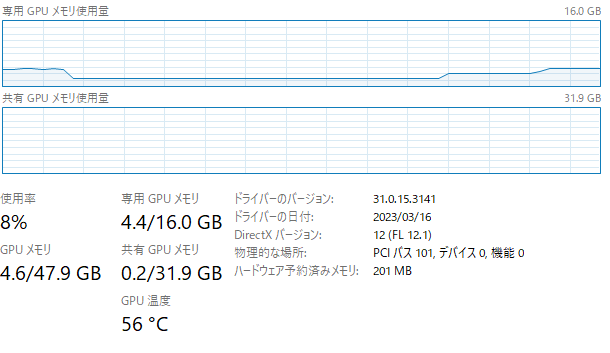
GPUメモリは2.5GBくらい。
コードはここです。
https://gist.github.com/kishida/ce97494f98871f0f84c8f6c6b4553886
